
Efficiency measurement
How to calculate boiler efficiency: direct and indirect methods
Run both the direct and indirect efficiency calculations on your own boiler, with worked numbers, the measurements each needs and the errors that inflate the result.
This post is also available inবাংলা
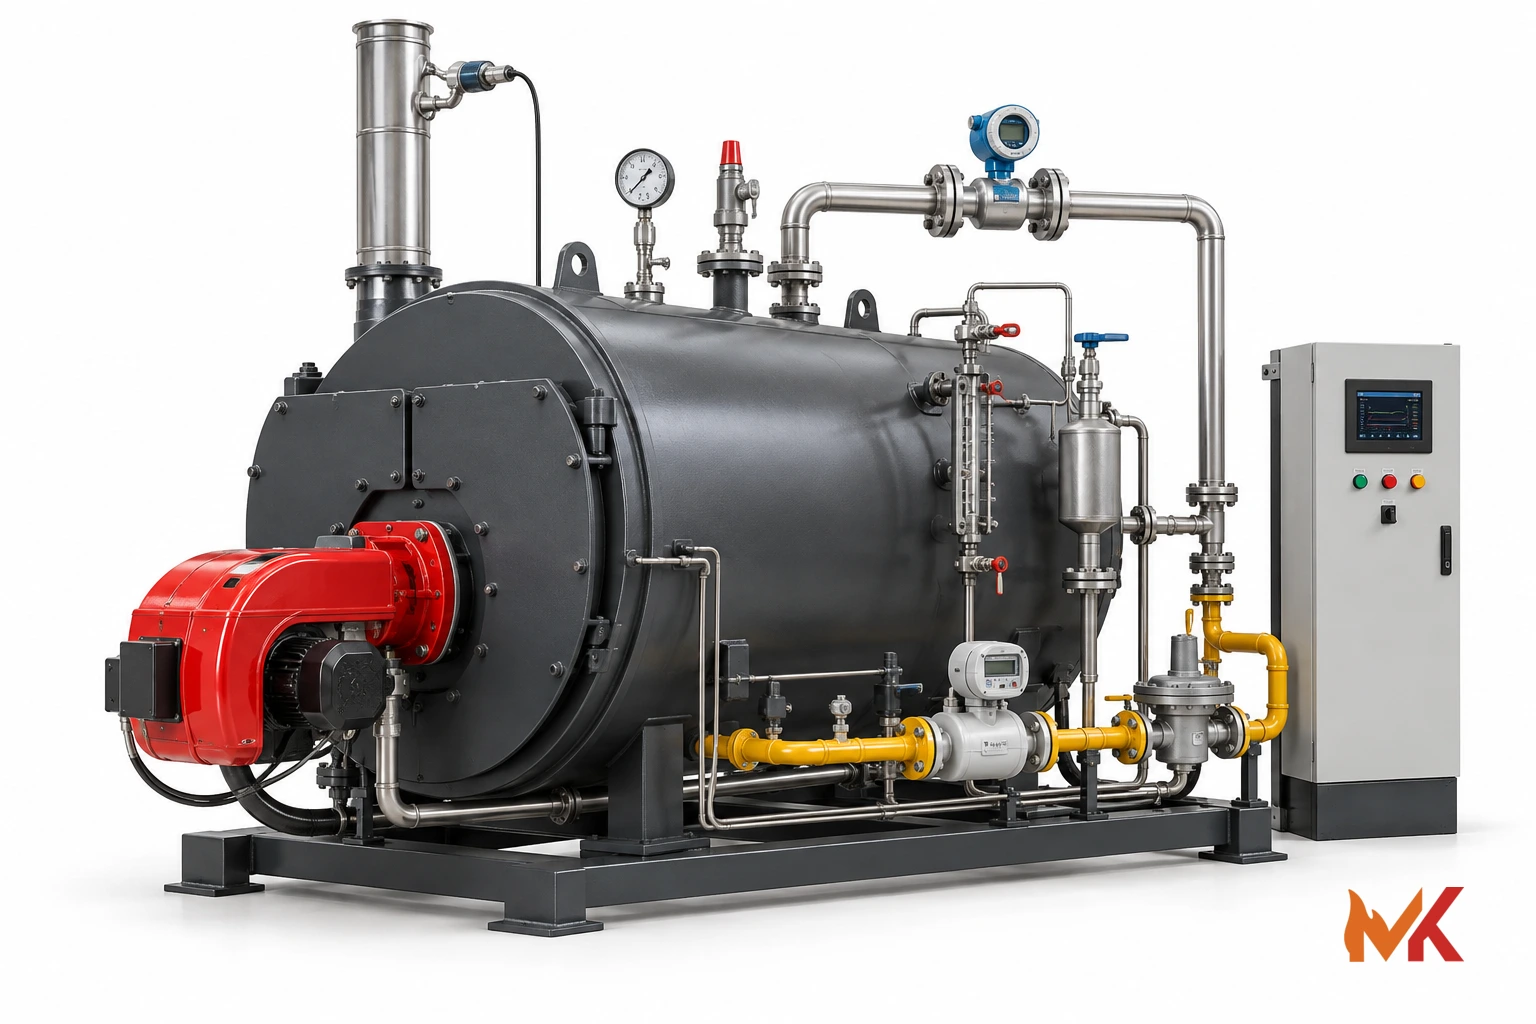
Most boiler efficiency figures quoted in a Bangladeshi factory come from a nameplate or a supplier brochure. Neither tells the utility DGM what the boiler is doing this month on this fuel at this load. Two calculations do, and both can be run with instruments most plants either already have or can hire for a day.
The direct method compares energy out with energy in. The indirect method adds up the losses and subtracts them from 100%. They answer different questions, and disagreement between them is itself useful information.
The direct method: output over input
Efficiency (%) = steam flow × (steam enthalpy − feedwater enthalpy) ÷ (fuel flow × gross calorific value) × 100
Take an illustrative fire-tube boiler in a Narayanganj dyeing unit running on natural gas:
| Measured quantity | Illustrative value |
|---|---|
| Steam generated | 4,000 kg/h at 10 bar g |
| Steam enthalpy at 10 bar g (saturated) | 2,780 kJ/kg |
| Feedwater temperature | 80 °C (enthalpy ≈ 335 kJ/kg) |
| Fuel consumption | 300 Sm³/h natural gas |
| Gross calorific value | 38,000 kJ/Sm³ |
Energy to steam = 4,000 × (2,780 − 335) = 9,780,000 kJ/h. Energy in fuel = 300 × 38,000 = 11,400,000 kJ/h. Efficiency = 9,780,000 ÷ 11,400,000 × 100 = 85.8% on a gross calorific value basis.
The calculation is simple; the measurements are where it goes wrong. Three checks before you trust the number:
- Is the steam flow real? An orifice or vortex meter calibrated for one pressure reads high or low if the header pressure has drifted. Some plants substitute feedwater flow, which is closer to the truth only if blowdown and any direct steam injection are accounted for separately.
- Is the calorific value measured or assumed? Gross and net values differ by roughly 10% for natural gas and more for wet biomass. Quoting a net-basis efficiency against a gross-basis fuel invoice produces a flattering, meaningless number.
- Is the fuel weighed? For rice husk or briquettes, hourly fuel rate has to come from weighed batches over a stable period, with moisture measured on the same sample. An assumed 3,200 kcal/kg for husk that is actually wet from monsoon storage can swing the result by ten points.
The indirect method: account for the losses
Efficiency (%) = 100 − (dry flue gas loss + moisture from hydrogen + moisture in fuel + moisture in air + radiation and convection + unburnt loss + blowdown loss)
The US Department of Energy’s tip sheet on improving boiler combustion efficiency and Spirax Sarco’s reference on boiler efficiency and combustion both work through this loss-by-loss approach. This is the approach behind BS 845 and ASME PTC 4 style testing, and it is what turns a number into an action list. A flue gas analyser giving O₂ or CO₂, CO and stack temperature does most of the work.
| Loss | What drives it | Typical corrective action |
|---|---|---|
| Dry flue gas | Excess air and stack temperature | Trim burner air, clean tubes, fit or clean the economiser |
| Moisture from hydrogen in fuel | Fuel chemistry | Fixed by fuel choice, not adjustable |
| Moisture in fuel | Biomass storage and season | Covered storage, pre-drying, purchase specification on moisture |
| Radiation and convection | Shell area, insulation, load factor | Insulation repair; avoid long low-load running |
| Unburnt carbon in ash | Grate settings, fuel size, air distribution | Secondary air, grate adjustment, screened fuel |
| Blowdown | Feedwater quality and TDS control | Condensate return, automatic TDS control, heat recovery |
A worked fragment of the largest loss: with 6% O₂ in the flue gas (about 40% excess air), a stack temperature of 220 °C and an ambient of 32 °C, the dry flue gas loss on natural gas typically falls in the 6–8% range. Drop excess air toward 15–20% and recover the stack to around 160 °C with an economiser, and that loss can fall by roughly two to three points. That is the estimate that justifies an economiser quotation, not a brochure claim.
Radiation and convection loss deserves a note because it is often stated as a fixed percentage. It is roughly constant in absolute kW, so as a percentage it grows as load falls. A 6 t/h boiler run at 1.5 t/h for the night shift will show a materially worse efficiency than the same boiler at full load, with nothing mechanically wrong.
When the two methods disagree
If the direct method gives 86% and the indirect gives 79%, one of the measurements is wrong. The usual suspects, in order:
- Blowdown not metered, so the energy leaving as hot blowdown water is credited to steam.
- Condensate return counted twice, once as returned energy and once as feedwater heating.
- Steam flow uncorrected for pressure or density.
- Fuel calorific value assumed from a supplier claim rather than tested.
- Test period too short, so a fuel weighing covers a different half-hour than the steam totaliser.
Resolve the discrepancy before reporting anything to management. A performance guarantee accepted on an unresolved 7-point gap is a dispute waiting for the first fuel bill.
Running a test your finance team can use
Hold conditions steady for at least an hour at a representative load, with no soot blowing, no batch start-up spike and no fuel changeover inside the window. Log steam totaliser start and end, fuel totaliser or weighed fuel, feedwater temperature, header pressure, flue gas O₂, CO and temperature, ambient temperature and blowdown activity.
Repeat at two or three loads that match how the plant actually runs — a full production shift, a light shift and the overnight condition. Plot efficiency against load. That curve, not a single peak number, is what justifies a burner modulation change, an economiser, or a decision to run one boiler instead of two.
To turn the efficiency figure into a cost per tonne of steam your finance team already recognises, follow the DOE method in Benchmark the Fuel Cost of Steam Generation.
Record the fuel basis on every page. A report that mixes gross-basis and net-basis figures cannot be compared with the next one, and the next test is the point of doing this one.
Pair this with a review of the losses you can act on quickly: failed steam traps, scale on the heat transfer surface and the annual maintenance schedule. For a measured efficiency test with a documented basis, contact our engineering desk or see our repair and maintenance service.
Related reading: Boiler blowdown: TDS control and heat recovery that pays, Condensate recovery: what it saves and what it costs to install and Achieving LEED certification in Bangladesh via steam and boiler upgrades.
Common questions
Which method should we use?
Run both if you can. The direct method answers what the boiler delivered for the fuel burned; the indirect method shows where the remaining energy went, which is what tells you what to fix.
Why is our calculated efficiency above 95%?
Almost always a measurement error rather than a good boiler: unmetered blowdown, a steam flow reading not corrected for pressure, an assumed calorific value, or condensate return counted as new feedwater.
Does a single test prove the boiler is efficient?
No. One test is a snapshot at one load. Repeat it at typical operating loads, on the same fuel basis, before judging a boiler or accepting a performance guarantee.
More from the blog
- Boiler selectionThermal oil heater vs steam boiler: choosing for your processCompare thermal fluid heaters and steam boilers on temperature, pressure, regulation, fire risk and running cost before committing capital in a Bangladesh plant.
- Steam efficiencyCondensate recovery: what it saves and what it costs to installWork out how much condensate your plant is dumping, what returning it is worth in fuel, water and chemicals, and which pump and pipework arrangement suits a dyeing floor.